A command line Packet Sniffer for Unix systems used for Network Traffic Analysis.
It can capture and interpret data frames from a network interface or a file.
I uses the libraries pcap and libpcap paired with an interface in promiscuous mode to listen to data.
When displaying TCP sequence numbers it will convert absolute sequence numbers (typically start with the bytes of the payload) into more easily understood relative sequence numbers (starting with 1).
Arguments
Some common arguments to tcpdump are:
-D: Display interfaces available to capture from.-i: Select an interface to capture from, e.g. -i eth0-n: Do not convert addresses (i.e., host addresses, port numbers, etc.) to names.-e: G the Ethernet Header along with upper-layer data.-X: Show Contents of packets in hex and ASCII.-XX: Same as X, but will also specify Ethernet headers. (like using Xe)-A: Show content only the ASCII text-L: Output packets in a different mode.-l: Format output for piping to other commands likegrep.-v, -vv, -vvv: Increase the verbosity of output shown and saved.-c: Grab a specific number of packets, then quit the program.-s: Define how much of a packet to grab.-S: Change relative sequence numbers in the capture display to absolute sequence numbers. (13248765839 instead of 101)-q: Print less protocol information.-r <file name>.pcap: Read from a file.-w <file name>.pcap: Write into a file.
When combining multiple of these place them behind one - each behind each one.
Filters
Its possible to filter the output from tcpdump either directly from capture or when reading from a file by using Berkeley Package Filters (BPF).
Examples
Tcpdump Shell Breakdown
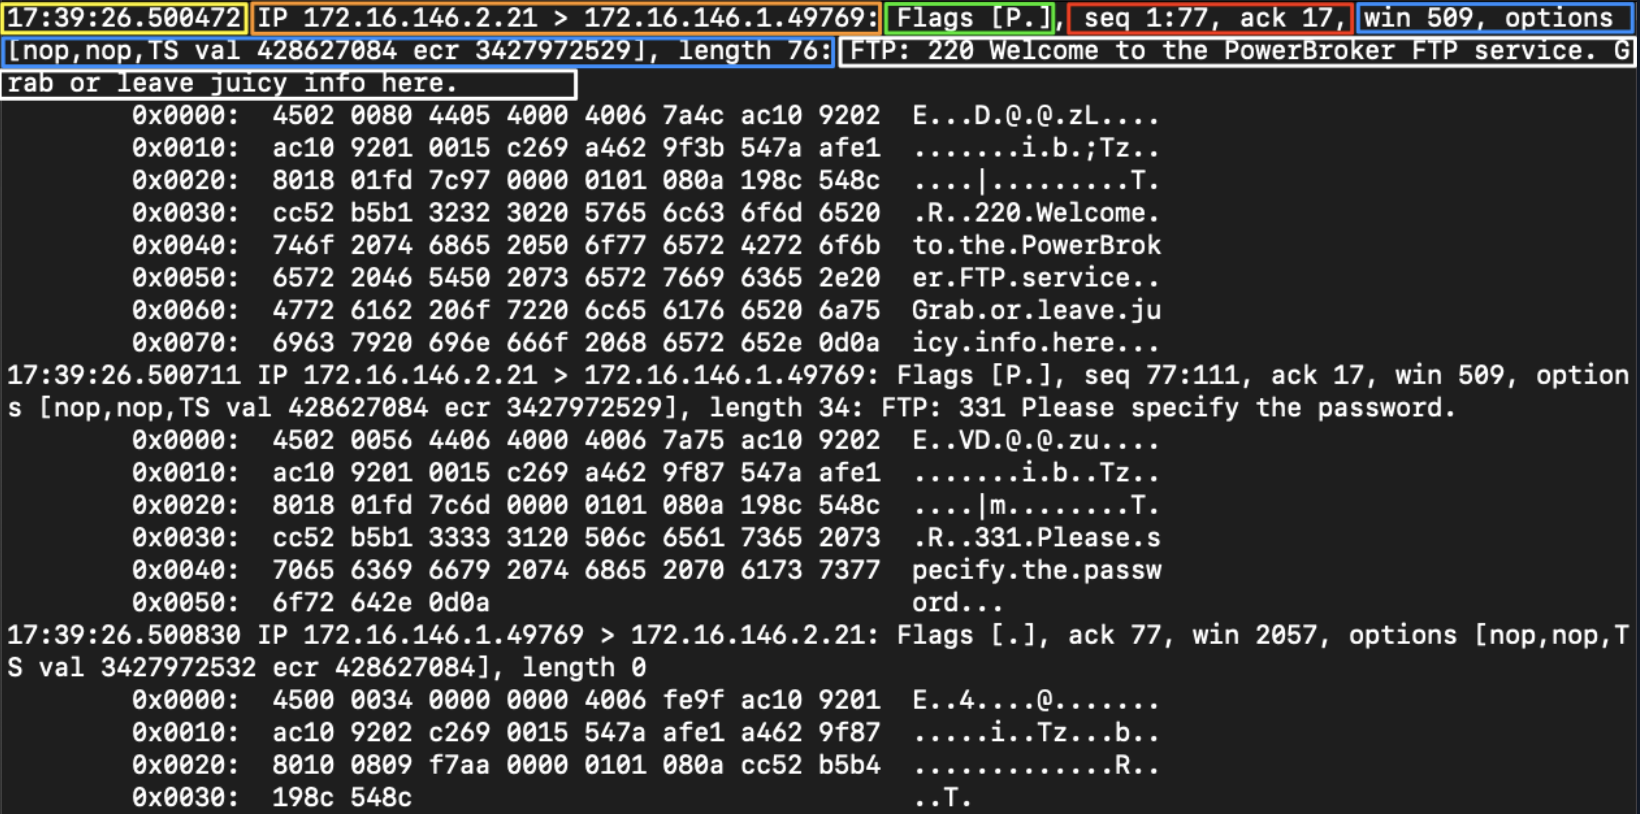 In the above output of
 tcpdump we see the following information:
Timestamp (Yellow): The timestamp field comes first and is configurable to show the time and date in a format we can ingest easily.Sequence and Acknowledgement (Orange): This section shows the sequence and acknowledgement numbers used to track the TCP Segment. Our example is utilising low numbers to assume that relative sequence and ack numbers are being displayed.Protocol (Orange): This section will tell us what the upper-layer header is. In our example, it shows the IP Address.Source & Destination IP.Port (Orange): This will show us the source and destination of the packet along with the port number used to connect. Format= IP.port =172.16.146.2.21Flags (Green): This portion shows any flags utilised.Sequence and Acknowledgement Numbers (Red): This section shows the sequence and acknowledgement numbers used to track the TCP segment. Our example is utilising low numbers to assume that relative sequence and ack numbers are being displayed.Protocol Options (Blue): Here, we will see any negotiated TCP values established between the client and server, such as window size, selective acknowledgements, window scale factors, and more.Notes / Next Header (White): Misc notes the dissector found will be present here. As the traffic we are looking at is encapsulated, we may see more header information for different protocols. In our example, we can see thetcpdumpdissector recognises FTP traffic within the encapsulation to display it for us.