An open-source GUI Packet Sniffer used for Network Traffic Analysis.
Packet Capturing
Can be started by navigating to Capture -> Options (keybinding C-k) and selecting the interface to start capturing traffic from.
Packet Information
Once packets have been captured they will be displayed as in the image below.
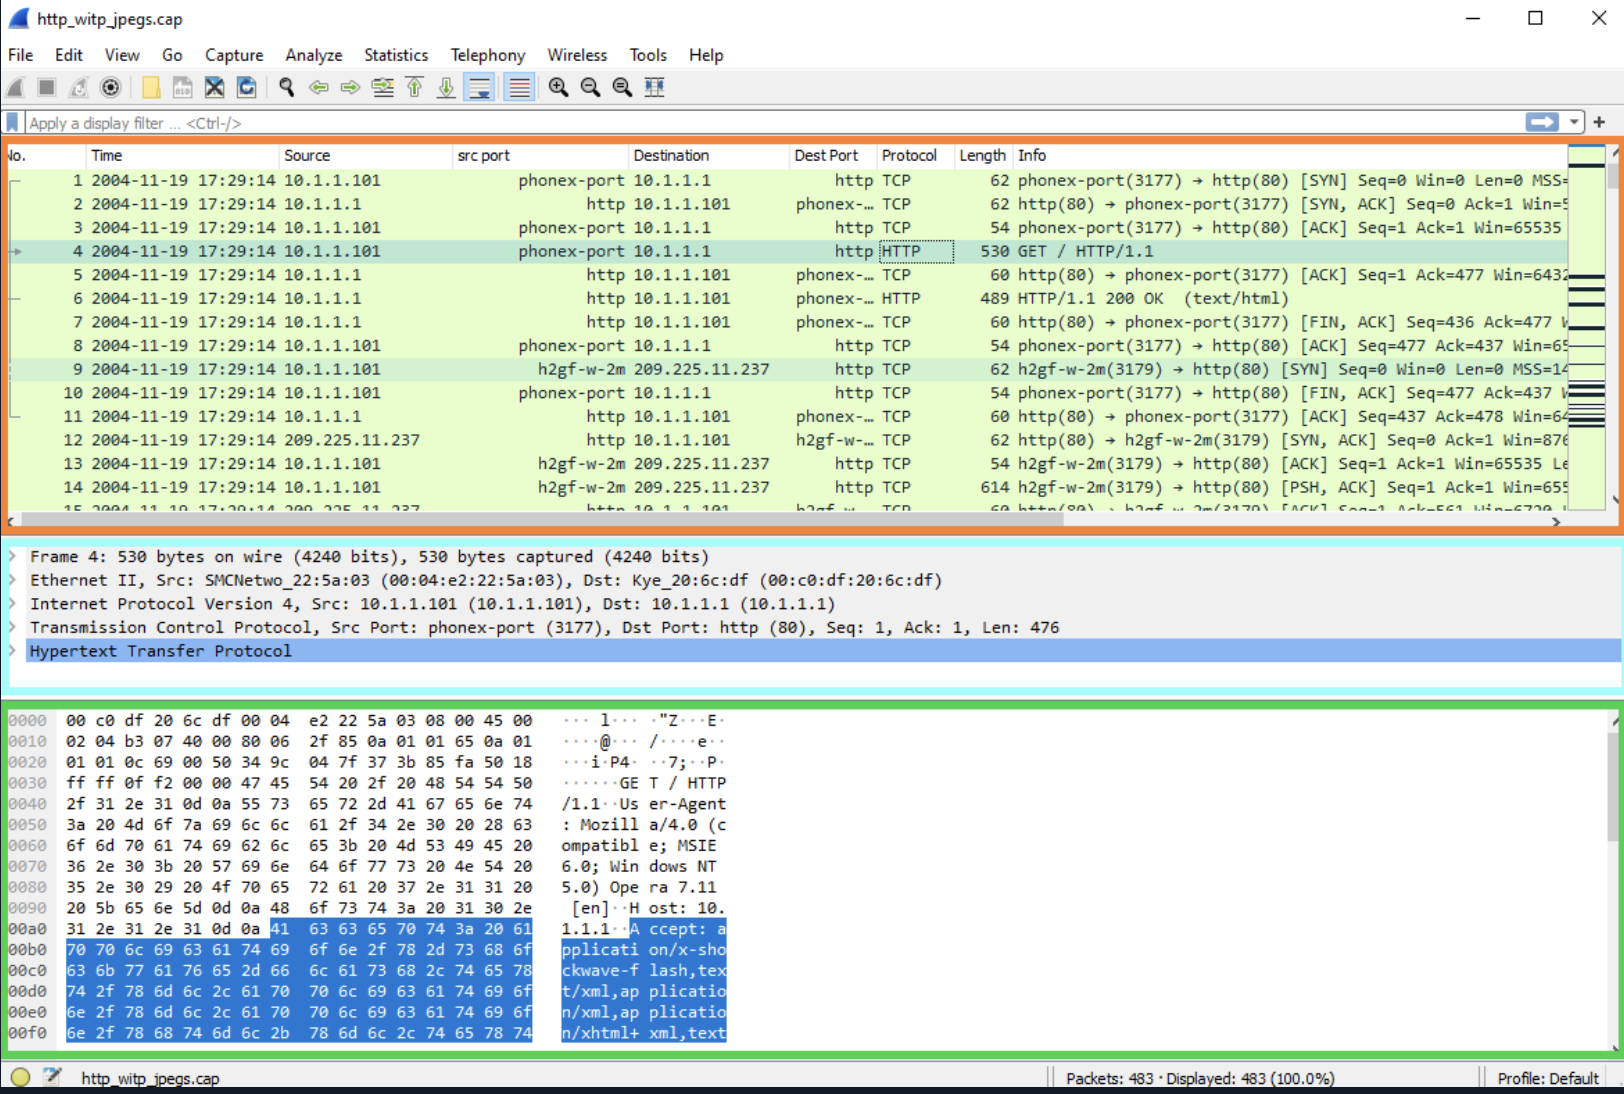
Here we see the following main panes:
Packet list (Orange): Shows the summary line of each Packet. These columns can be configured.Packet details (Blue): Shows the different Protocols used when Encapsulating the Packet.Packet bytes (Green): Shows the contents of the Packet in ASCII or Hexadecimal.
Filtering
Capture Filters
Berkeley Package Filters (BPF) that are entered before the capture is started, to drop all packets according to the filter.
These can be added by navigating to Capture -> Capture Filters.
Display Filters
Can be used after capture has been started and is used only to filter what is displayed, not what is captured.
These have different syntax than capture filters. Below are some common display filters:
ip.addr =x.x.x.x=: Captures only traffic pertaining to a specific host (OR statement).ip.addr =x.x.x.x/24=: Captures traffic pertaining to a specific network (OR statement).ip.src/dst =x.x.x.x=: Captures traffic to or from a specific host.dns/tcp/ftp/arp/ip: Filters traffic by a specific protocol (many more options exist).tcp.port =x=: Filters by a specific TCP port.tcp.port/udp.port !x=: Captures everything except the specified port.and: Concatenates filters with an AND condition (both must be true).or: Finds traffic matching either of two conditions.not: Excludes traffic matching the specified condition.
Display filters are added in the main Wireshark capture window in a bar right above the column names for the packet list.
Plugins
There are several plugins that expand on the handling of Packet information in Wireshark.
Statistics Tab
Can show top talkers and give a distribution of the Protocols used in the captured traffic.
Analyse Tab
Follow TCP Streams
A tool for seeing the content of packets in an entire TCP connection in order.
Can be accessed by right-clicking a packet -> Follow -> TCP Stream (keybinding C-Alt-S-t).